‘Party stronghold’ concept is perhaps a marketing ploy by local politicians to attract voters to the preferred party or to extract resources from candidates.
An important ongoing discussion in some political circles in India is whether the Election Commission should limit public access to the so-called Form 20 data, which reports the exact number of votes that each candidate receives in each polling booth in an election. The Form 20 data has been made available for the 2009 and the 2014 general elections, and also for the state elections held in recent years.
The main reason offered by those who want to limit access to this data is that it is an important democratic principle that the vote is kept secret, and if the data reveals that most voters in a polling booth vote for the same party, it is no longer so secret how someone votes.
This knowledge is important because it might allow powerful people to control the vote in a polling booth, undermining the freedom of the vote.
The underlying assumption these individuals are making is that there are many areas across the country where certain political parties wield significant control. In other words, parties have many strongholds, which deliver overwhelming votes in their favour, election after election.
However, a look at the polling-booth level data reveals that this assumption is incorrect.
Also read: It’s a myth that 2014 election was exceptional in the vote share of winning candidates
Fragmented vote
First, there is a vigorous competition for votes in most polling stations. Second, there are very few polling stations that voted overwhelmingly for the same party in the 2009 and the 2014 Lok Sabha elections. Third, even at the polling-booth level, there is an enormous swing in the vote share of different parties from one election to the next.
In other words, even with access to the Form 20 data, it is virtually impossible to know how people vote.
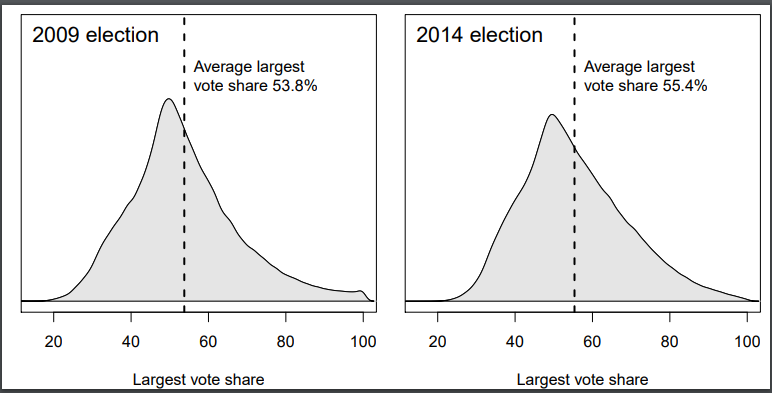
Figure 1 shows polling-booth level data for approximately 2.85 lakh villages and towns across 11 states for 2009 and 2014 elections.
We report the ‘largest’ vote share for each polling booth and not the ‘winning’ vote share because no candidate really wins a polling booth. Victory or losses are at the parliamentary constituency level.
In 2009, the average largest vote share in a locality was just below 54 per cent; in 2014, it was just over 55 per cent. In both 2009 and 2014, there were some villages and towns where the largest vote share obtained by any party was as low as 20 per cent whereas it soared to 100 per cent in a few places. However, in the vast majority of localities (about 80 per cent), the largest vote share was between 35 per cent and 70 per cent. This means that in most places the vote is so fragmented that it is impossible to know how any individual voted.
Figure 1: The largest vote share for any party in 2.85 lakh villages and towns in 11 Indian states
Few local-level strongholds
These data should raise concern about claims that Indian elections have electoral strongholds.
We can see in Figure 1 that it is uncommon for any one party to get a large share of the votes in any place. However, to put another nail in the electoral-stronghold coffin, we assess what happens to the vote share of parties across both the elections: for a party to really have an electoral stronghold, it should get a large share of the votes in that particular area over at least two consecutive elections.
Also read: Political parties dominate India’s national elections, not candidates
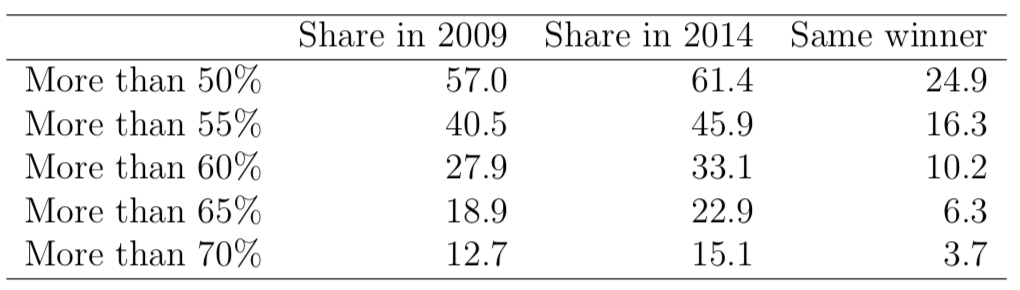
Table 1 shows the percentage of villages and towns where the party getting the highest number of votes was able to capture more than 50 per cent, 55 per cent, 60 per cent, 65 per cent, and 70 per cent of the total votes respectively. The last column shows the percentage of localities where the same party was able to capture at least this share of the votes across the 2009 and 2014 elections.
The same party was able to capture more than 50 per cent of the votes in about a quarter of the localities in the data. This percentage shrinks rapidly when we examine higher vote shares. Only about one in 10 villages or towns supported the same party with more than 60 per cent of the votes across the two elections, and in less than four per cent of the localities was the same party able to capture more than 70 per cent of the votes across both elections.
From these data, it is quite clear that there are very few local-level strongholds in Indian elections. The fact that one often hears about party strongholds is perhaps a result of a marketing ploy by local politicians to try to attract more voters to their preferred party or to extract resources from candidates running for the election.
Table 1: Local-level vote share for the winning parties in 2009, 2014, and across both elections
Electoral volatility
Not only are there almost no strongholds at the local level in Indian elections, but there is also enormous volatility (an idea similar to vote swing) from one election to the next. Electoral volatility can be understood as the absolute change in the vote share of each party from one election to the next, divided by two.
If each party gets the same number of votes across elections, the electoral volatility is zero. If all parties competing in a constituency are new (i.e. the old parties get no votes), then there is a 100 per cent swing away from the old parties and a 100 per cent swing to the new parties, making the electoral volatility 100. If there are two parties in a constituency and one party’s vote share falls from 70 per cent to 30 per cent and the other party’s vote share increases from 30 per cent to 70 per cent, the total electoral volatility is 40 (the change in vote share of both parties divided by two).
Countries in western Europe, which generally have a smaller population and a long democratic tradition (50 years or more), report average electoral volatility that ranges from 3.4 for the United States to 18.1 for France. In Asia, Japan’s electoral volatility is 14.1 and Sri Lanka’s is 16.7. The electoral volatility for India between 1951 and 2004 has been reported at 26.7. In our local-level voting data, the average electoral volatility at the polling-booth level in India is 36.7¹.
The large local-level electoral volatility is a clear indication that Indian elections are highly unpredictable and that no party can take its votes as ‘guaranteed’ in any locality. This again indicates that parties really do not have local-level strongholds.